
Fiddler is a proxy that can intercept all the HTTP(S) traffic that’s flowing between your client and the server you’re connected to.
We can install Fiddler by visiting the http://www.fiddler2.com website and downloading the Fiddler2 or Fiddler4 based on which .NET we have installed. If we have .NET 4 installed, we can download Fidder4, otherwise, download Fiddler2. Once the Fiddler executable is downloaded, we can simply install it by next-clicking. After the successful installation, we can start Fiddler. The basic Fiddler window is presented in the picture below.

Once the Fiddler is running, it should start listening on port 8888, which we can verify with a simple netstat command as we can see in the picture below.
![]()
This is all fine and all, but so what? Well, we can instruct IE or any other browser to use the port on which Fiddler is listening as a proxy, which will enable us to intercept requests and responses the browser is making in Fiddler. In our case we’ll set Firefox web browser to send requests to the Fiddler proxy on port 8888; we can do that by opening Connection Settings under the Firefox Options and setting the Manual proxy to 127.0.0.1:8888 as we can see in the picture below.

If we access www.google.com website in the Firefox now, we’ll see requests and responses flowing through Fiddler.

In the picture above we can see all requests that we sent to www.google.si webserver. Let’s explain what the columns on the picture above mean: – # : the ID of the request – Result : the HTTP status code of the HTTP response – Protocol : the protocol used by this request – Host : the hostname of the server we’re connected with – URL : the actual URL that was requested on the server – Body : the size of the body in bytes – Caching : the Cache-Control HTTP header specified in the response – Content-Type : the Content-Type HTTP header specified in the response – Custom : can be used with scripting capabilities – Comments : can be used with scripting capabilities.
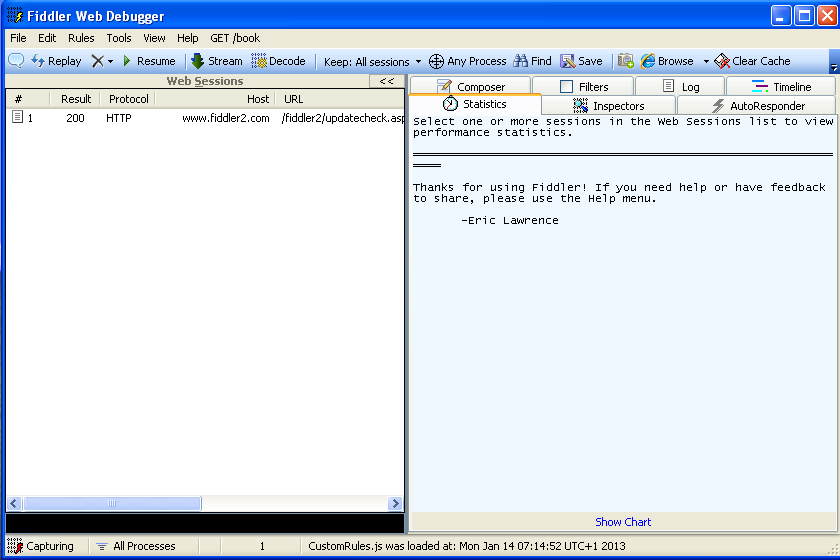
Each request also has seven tabs, which are described below: – Statistics : presents various information about the session; the information is most useful if we select several sessions because the statistics of all of them will be shown. Let’s take a look at an example.

In the picture above, we can see that we selected 185 requests, of which there are 32 unique hosts and the total bytes sent are 145.499 bytes. We can also see a summary of response codes: there were 168 responses with a response code 200, 8 with 302, 8 with 204, and 1 with a response code 307.
– Inspectors : presents the request and response in various ways. Let’s present the request and response to the www.google.si website by using the raw view; this can be seen in the picture below.

– AutoResponder: can be used to return previously generated responses instead of connecting to the server. – Composer: can be used to clone a request by dragging and dropping a session into the view and executing it. – Filters: can be used to filter the session in the session view if we want for example view only the session of one of the hostnames we’re currently testing. – Log: provides a logging facility for Fiddler. – Timeline: allows us to present the HTTP session on a diagram based on time; we can select multiple sessions and all of them will be presented on the screen.
Intercept HTTPS
Let’s try to intercept Fiddler’s HTTPS traffic. If we visit URL https://www.google.com (notice that the HTTPS secure protocol is being used), the Fiddler will just pass the request through, but will not be able to actually see the contents. We can see that in the picture below.

We can see that the Fiddler has written “Tunnel to” in the Host column, which is a clear indicator that we’re connecting through HTTPS. But on the bottom half of the picture above, we can also see that Fiddler has provided a text notifying us that this is a raw HTTP tunnel that enables a client to send raw traffic through a proxy. At first glance, it seems that we can’t see the traffic that’s being sent through HTTPS, but we indeed can. To do that, we must go to Tools – Fiddler Options – HTTPS and enable the options as can be seen in the picture below.

If we revisit the HTTPS page now, we would be able to see the traffic flowing through Fiddler.
Executing Commands
At the bottom part of the Fiddler we can notice an input box, where it says “ALT-Q > type HELP…”; this is an input box, where we can enter and execute various useful commands.
The most basic commands will be described below. – ?text: when typing text, the Fiddler will select the sessions that contain that text in the URL. Let’s take a look at an example:
We’ve inputted the ?search into the input box, which effectively searches for the text “search” in the URL of each and every request. On the upper half of the screen, we can see that one session is highlighted with a gray color (the session has an ID 6). – >size: selects sessions that have a response size greater than the specified size. –
– =status: selects the responses that have the HTTP status code equal to the specified status code. The picture presents all the responses that have the HTTP response code 200 (highlighted in grey):
– =method: selects the requests that use the method to get the specific resource. The picture below presents all the requests that used the POST method to get specific resources:
– select MIME: selects the sessions whose Content-Type HTTP header equals the specified MIME type.
Breakpoints
We can also set breakpoints in Fiddler, but these are not actually the same breakpoints as in Ida Pro, Ollydbg, or some other debugger; here we’re setting a breakpoint on requests/responses, so we can intercept them before being sent and alter their values, which can be valuable in penetration testing. We can do that by clicking the Rules – Automatic Breakpoints and selecting either “Before Requests” or “After Responses” to set a breakpoint on the request or response. We can see all of the options in the picture below:
Let’s now set the “Before Requests” option to set the breakpoint on requests, so we can modify each request before actually sending it to the server. Once, we enable the breakpoint on requests, we can send a request to a webpage like “http://www.najdi.si”, and the request will be caught and waiting for us to modify it and send it forward to the requested server. We can see the request waiting on the picture below:
At the top of the window, we can see that we’re dealing with a request to the Host www.najd.si, but we can immediately notice something strange: the icon beside the request is red and has a letter T in it; this tells us that we’ve captured the request and is waiting to be processed. At the bottom part of the picture, we can also see the HTTP headers that will be sent to the server and the text “Breakpoint hit.” that’s written on the red background. We can now click on the Raw button above, change the HTTP headers or URI and press the “Run to completion” button to send the request to the server to be processed.
Conclusion
We’ve seen the basic introduction to Fiddler, a tool we can use to change requests and responses when trying to pentest a web application.