
We can imagine a face of a person in a CFP review board that sees our paper submitted to a conference. “Oh no, another Wi-Fi talk”. But after reading it through one can see Wi-Fi from a different angle. We are presenting a way how to cross from terminal output of Wi-Fi packets to big data and visualization.
ELK stack stands for Elasticsearch, Logstash, and Kibana. It’s mostly used in corporate networks where a lot of servers and applications are producing logs. There is a need to have control of events happening in a network. But how to get an overview of those events if we have logs in different formats and sizes and also at different locations. ELK stack is an elegant solution where Logstash is used for centralizing, structuring, and enriching data, Elasticsearch for storing searching and analysis, and Kibana for visualizing and hiding all the complex queries to Elasticsearch (bringing it down to just a few clicks). But be aware, this post is not about setting up ELK stack in a usual way. There are many tutorials on how to do it. For example, https://www.digitalocean.com/community/tutorials/how-to-install-elasticsearch-logstash-and-kibana-elk-stack-on-ubuntu-14-04 is a good starting point for you, if you don’t have experience with ELK. But if you do, you should continue reading. We will talk about how to setup ELK to monitor and analyze Wi-Fi data that is coming from airodump-ng tool.
1. Airodump-ng patching
Assuming ELK was already set up there are few things we need to do in order to visualize Wi-Fi packets. The first is modifying and building airodump-ng tool from aircrack-ng package. Airodump-ng is a tool from aircrack-ng tool-set, a “must have” every penetration tester and security expert when analyzing Wi-Fi networks. The latest source is available at http://www.aircrack-ng.org/downloads.html. After downloading we need to apply a patch that gives airodump-ng the option to output Wi-Fi data to a JSON formatted log file. The patch is available at https://github.com/viris/wifi. Below is a screenshot of applying the patch to Aircrack-ng 1.2 RC 3.
After applying the patch, “make” should be enough to build aircrack-ng. To check that everything is working fine we go into “src” directory and run
./airodump-ng wlan0mon --output-format json -w /opti/wifidata/data
Here we assume that wlan0mon is the monitoring interface that was put up with
airmon-ng start wlan0
and /opt/wifidata is the folder that will contain our Wi-Fi data. If everything is ok, data-01.json is present in /opt/wifidata.
2. Logstash configuration
We are assuming that Kibana and Elasticsearch are ready and running on our system. Or at least Elasticsearch is, so that Logstash can forward data to it. If we want to be sure that the Elasticsearch instance is running we can do a quick check with
curl http://localhost:9200
When seeing a response from Elasticsearch we are good to go. But before that just one quick note about security.
A netstat -lntp
reveals on which port and local address is Elasticsearch listening. The local address should be 127.0.0.1 unless we plan to expose all the data to the public. ? Now that we are sure that Elasticsearch is running, we should run Logstash with the below configuration file (from https://github.com/viris/wifi).
input {
file {
path => "/opt/wifidata/*.json"
start_position => "beginning"
type => "wifi"
}
}
filter {
if [type]== "wifi" {
json {
source => "message"
}
if [wlan_type] == "CL" {
mutate {
rename => ["ProbedESSIDs", "ProbedESSIDsArray"]
add_field => ["ProbedESSIDs","%{ProbedESSIDsArray}"]
split => ["ProbedESSIDsArray", ","]
}
}
}
}
output {
elasticsearch {
template => "/opt/logstash/templates/wifi-template"
template_name => "wifi"
hosts => localhost
index => "wifi-%{+dd.MM.YYYY}"
}
stdout { codec => rubydebug }
}
Assuming Logstash is installed in /opt/logstash and that the configuration file above is named logstash-wifi-file.conf, we can run Logstash as
/opt/logstash/bin/logstash -f logstash-wifi-file.conf
Running Logstash direct from the command line is handy for debugging. Later we can make Logstash run as a service. Just one note on the configuration file before we continue. The input is chosen to be a file or files with JSON extension and are located in /opt/wifidata/ (other inputs like tcp or lumberjack could be chosen). In the filter section, we tell Logstash that the input is JSON and after that do some simple modification on ProbedESSIDs field. The output is Elasticsearch instance on localhost and standard output using rubydebug codec. In the output->elasticsearch section, we also use a template for our data. The template is available at https://github.com/viris/wifi and is in greater part a copy of Logstash default template.
3. Connecting the dots …
Now that everything is ready we run our modified version of airodump-ng
airodump-ng wlan0mon –output-format json -w /opt/wifidata/data –channel 6 –manufacturer
If Logstash is running with the presented configuration, we should notice the output below.
By now data forwarded from Logstash to Elasticsearch should be visible in Kibana.
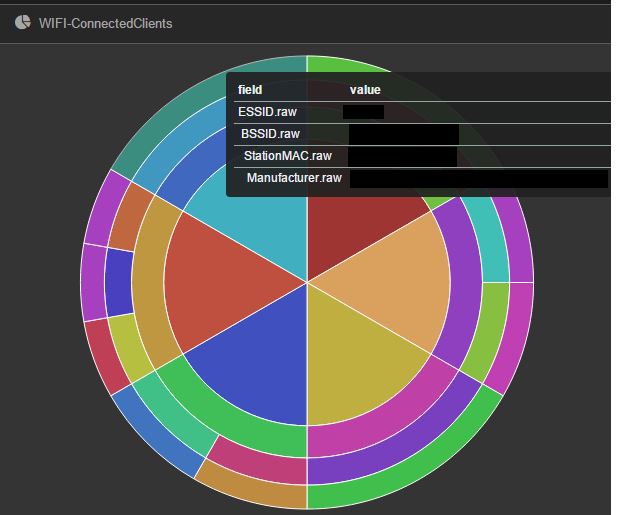
But Kibana’s power lies behind visualization. If we know what we want, then we are only a few clicks away from the final result. Below is an example of a graph showing Wi-Fi networks (from inside to outside) that are available, physical access points forming those networks, clients that are connected to access points, and the manufacturer of those client devices. The graph construction is left to the reader.